How to Create a Table in Excel: Tips for 2025
Tables in Excel are essential tools that enhance data organization and analysis, making them indispensable in both professional and personal contexts. In this guide, we will cover the how to create a table in Excel with practical examples and tips that cater to both beginners and experienced users. By the end, you’ll be well-equipped to utilize tables effectively for managing and visualizing your data.
Understanding Excel Table Features
When it comes to creating structured tables in Excel, understanding the various features is crucial. Excel tables are not merely lists of data; they’re dynamic sets of information that come with numerous built-in benefits. For one, tables provide an easy way to manage and analyze row and column data. Features like sorting, filtering, and structured referencing enhance data manipulation, allowing users to navigate through large datasets smoothly.
Active Features of Excel Tables
One of the standout aspects of using Excel for tables is the ability to apply dynamic sorting and filtering. With a simple click on the dropdown arrows in the headers, you can sort data alphabetically or numerically and filter with conditions to quickly find the information you need. Furthermore, table features in Excel include predefined table styles that enhance visual data presentation, making your data more recognizable at a glance.
Advanced Table Functions
Excel tables also come with integrated functions that streamline your workflows. The Excel table functions enable you to conduct complex data analysis without writing extensive formulas. For instance, with structured references, you can easily refer to table columns by names, making your formulas easier to read and manage. This feature enhances Excel’s usability, especially for tasks that involve repetitive calculations and data analysis.
Visualizing Data with Tables
A significant aspect of Excel data visualization is using charts linked with your tables. Once your data is structured as a table, creating charts based on your data becomes seamless. This functionality allows for real-time updates; whenever the table data changes, the corresponding chart reflects these changes automatically, providing valuable insights at a glance.
Step-by-Step Guide to Creating Excel Tables
If you’re wondering how to create a table in Excel, follow these simple steps to turn your data into an organized table.
1. Select Your Data Range
The first step is to select the range of cells that contain the data you’d like to include in your table. Be cautious to include the headers—that is, the titles that describe the contents of each column—as these will become the headers of your table.
2. Insert the Table
With the data range selected, navigate to the Insert tab on the ribbon and choose Table. A dialogue box will prompt you to confirm the selected range and verify whether your table has headers. After confirming, click OK to create your table.
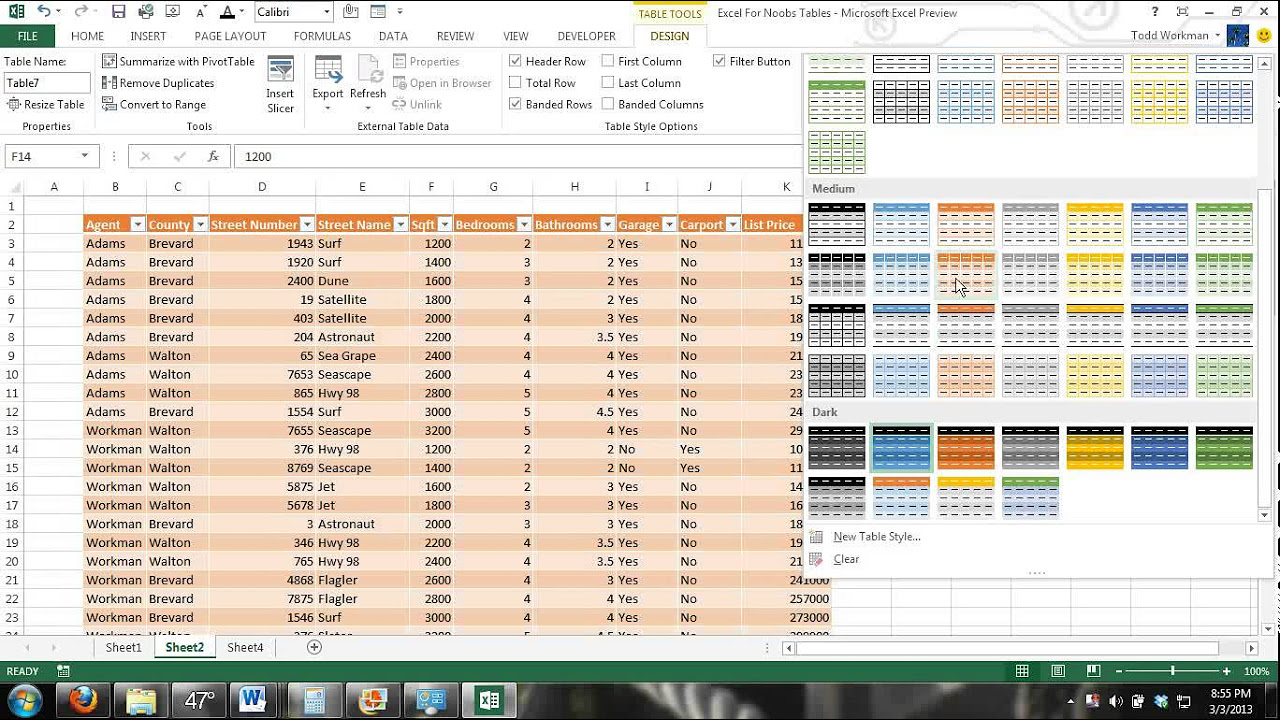
3. Customize Table Styles
Once created, you can customize your table with various formatting options under the Table Design tab. Here, you can select styles, adjust colors, and even manage how Excel will display totals and banded rows, enhancing both function and appearance.
Excel Table Shortcuts and Tips
Growing comfortable with shortcuts can drastically improve your efficiency when working with tables in Excel. Here are some invaluable tips for Excel table shortcuts and management.
Using Keyboard Shortcuts
Familiarizing yourself with **keyboard shortcuts** saves time. For instance, pressing Ctrl + T quickly converts any range of data into a table, while Ctrl + Arrow Keys help you navigate through your table efficiently. These shortcuts enhance the effectiveness of using Excel for data manipulation and organization.
Filtering and Sorting Quickly
Utilizing the filter and sort dropdowns on the table headers can help you to sift through large data sets without hassle. Sorting data in Excel is straightforward—just click on the arrow next to the column header and select your preferred sorting method. By leveraging these capabilities, you can manage organized data presentations effectively.
Dynamic Tables and their Practical Uses
**Dynamic tables in Excel** are invaluable for real-time data analysis. As your data changes, the table automatically adjusts to reflect these changes. This makes tables particularly effective for reporting purposes, providing persistent visibility into data fluctuations. For example, in business reporting, having dynamic tables streamlined into dashboards can greatly enhance data storytelling capabilities.
Conclusion and Further Learning
By now, you should have a solid understanding of how to create tables in Excel and the various features that enhance their functionality for **efficient data management in Excel**. With practice, you can master these skills and incorporate tables into your workflows, whether for simple tasks or advanced data reporting. For further learning and tutorials, check out the additional resources on Excel tutorials or brush up on your skills with advanced Excel techniques.
FAQ
1. Why should I use tables in Excel?
Using **tables in Excel** provides a structured way to manage and analyze data. They come with built-in features for easy sorting, filtering, and enhanced data visualization, streamlining the process of data analysis and reporting.
2. Can I create charts from Excel tables?
Yes! Tables in Excel can be directly converted into charts. When you create a chart based on a table, any updates you make to the table will automatically reflect in the chart, which aids in effective **data presentation in Excel**.
3. How do I format tables in Excel?
Formatting tables in **Excel** can be easily done through the styles available under the **Table Design** tab after you have created your table. Here you can change color themes, apply banded rows and adjust total rows to enhance readability and presentation.
4. What are dynamic tables in Excel?
Dynamic tables in Excel are tables that automatically update when the data or input changes. They are excellent for real-time data management and are particularly useful for ongoing data analysis and business reporting.
5. Are there shortcuts to manage tables in Excel?
Yes! There are various **Excel shortcuts** like Ctrl + T to create a table and Tab to navigate through table cells, which facilitate quick and efficient management of tables, streamlining your workflow considerably.
For those looking to deepen their understanding further, be sure to explore additional tutorials and guides.